Data Loaders - Get Any Source Into the Platform Today, and Keep It Coming

Introducing Data Loaders
Some data cannot wait for a project. A client sends a spreadsheet, a desk needs a government statistic, a broker starts sending a new file, and the traders want it on the platform this week, not next quarter.
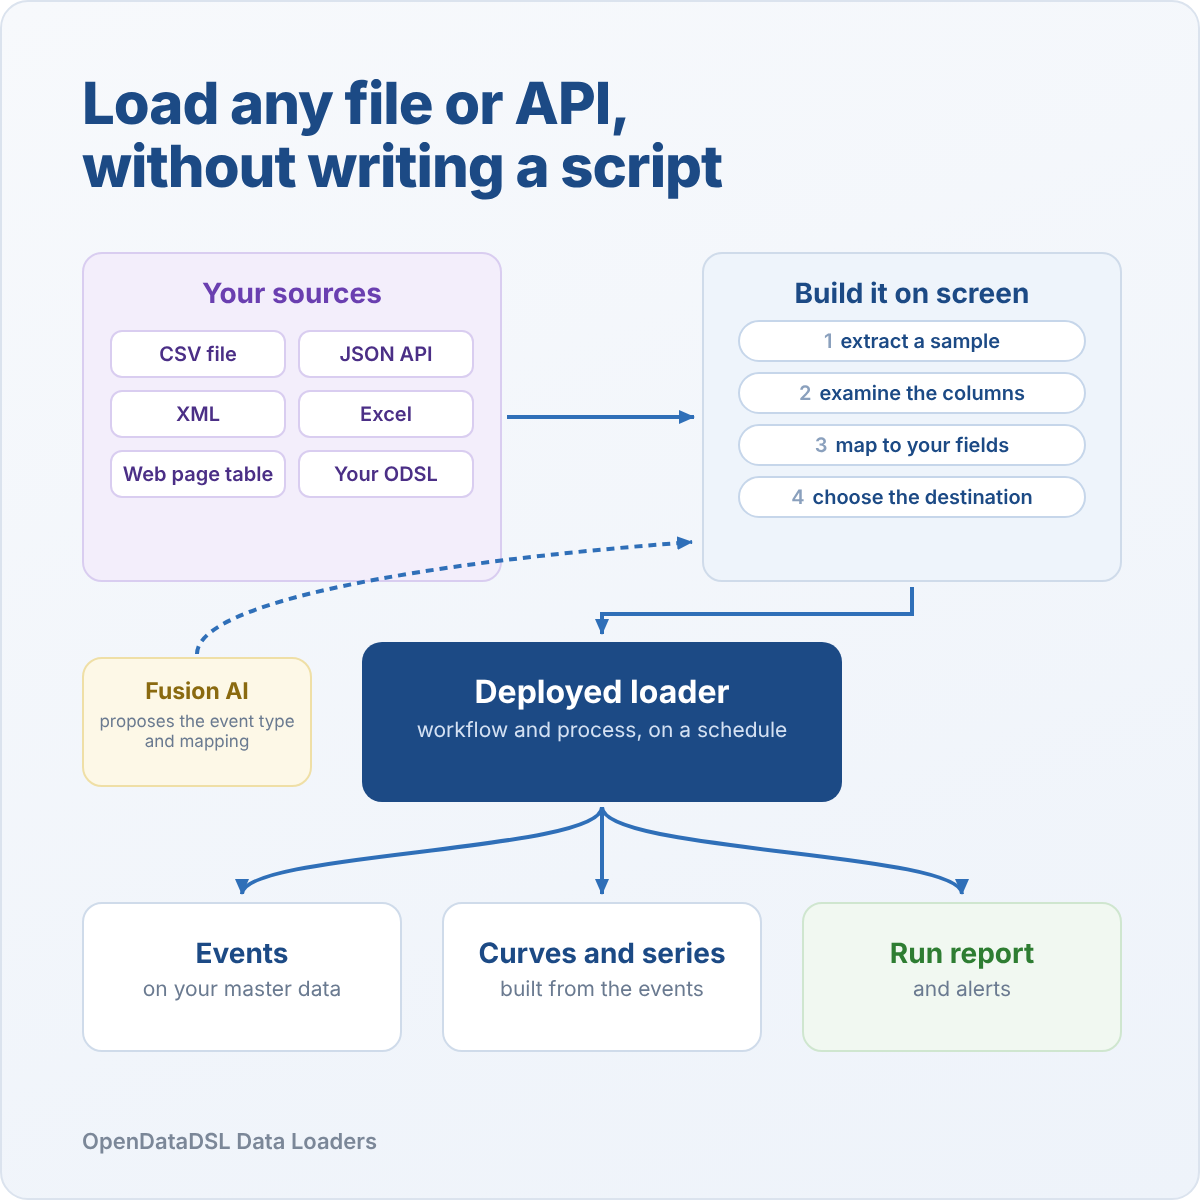
Data Loaders is the quick way in. Point it at the file, API or web page, map it on screen with a real sample in front of you, and deploy it on a schedule. It is in the platform and running the same day, with a report of every run. And when there is no URL at all, drop the workbook on the page.
When the data cannot wait for a project
Most of the data on the platform arrives the strategic way: through the Data Catalogue, a managed feed from a vendor, or an integration built and tested for the long term. That is the right home for the data your business runs on every day.
But there is always a gap between needing a source and having it. A new broker's end of day file. A client's monthly price workbook. Stock levels from the EIA, or Japanese wholesale prices from e-Stat. Prices in a table on a supplier's web page. Each one is too small to be a project and too important to leave in someone's spreadsheet.
Data Loaders fills that gap. It is a tactical tool: get the source in today, scheduled and monitored, and decide later whether it deserves a managed feed. Many never need one.
From a URL to scheduled data in an afternoon
A data loader is built in a few steps, and each one shows you what the platform has actually read.
Extract. Choose the kind of source and give its URL:
- CSV and text files, any separator, with or without a header line
- JSON APIs, with the path to the records
- XML documents and Excel workbooks, by element or by sheet
- Tables on web pages, picked by clicking them
- Your own ODSL, for anything the others cannot read
The URL can contain the date being loaded, such as settlements_{date:yyyyMMdd}.csv, so the same loader picks up each day's file.
Examine. The platform reads a sample exactly as a run will and shows you every row, with a profile of each column: what it looks like, how full it is, how many distinct values it has and their range.
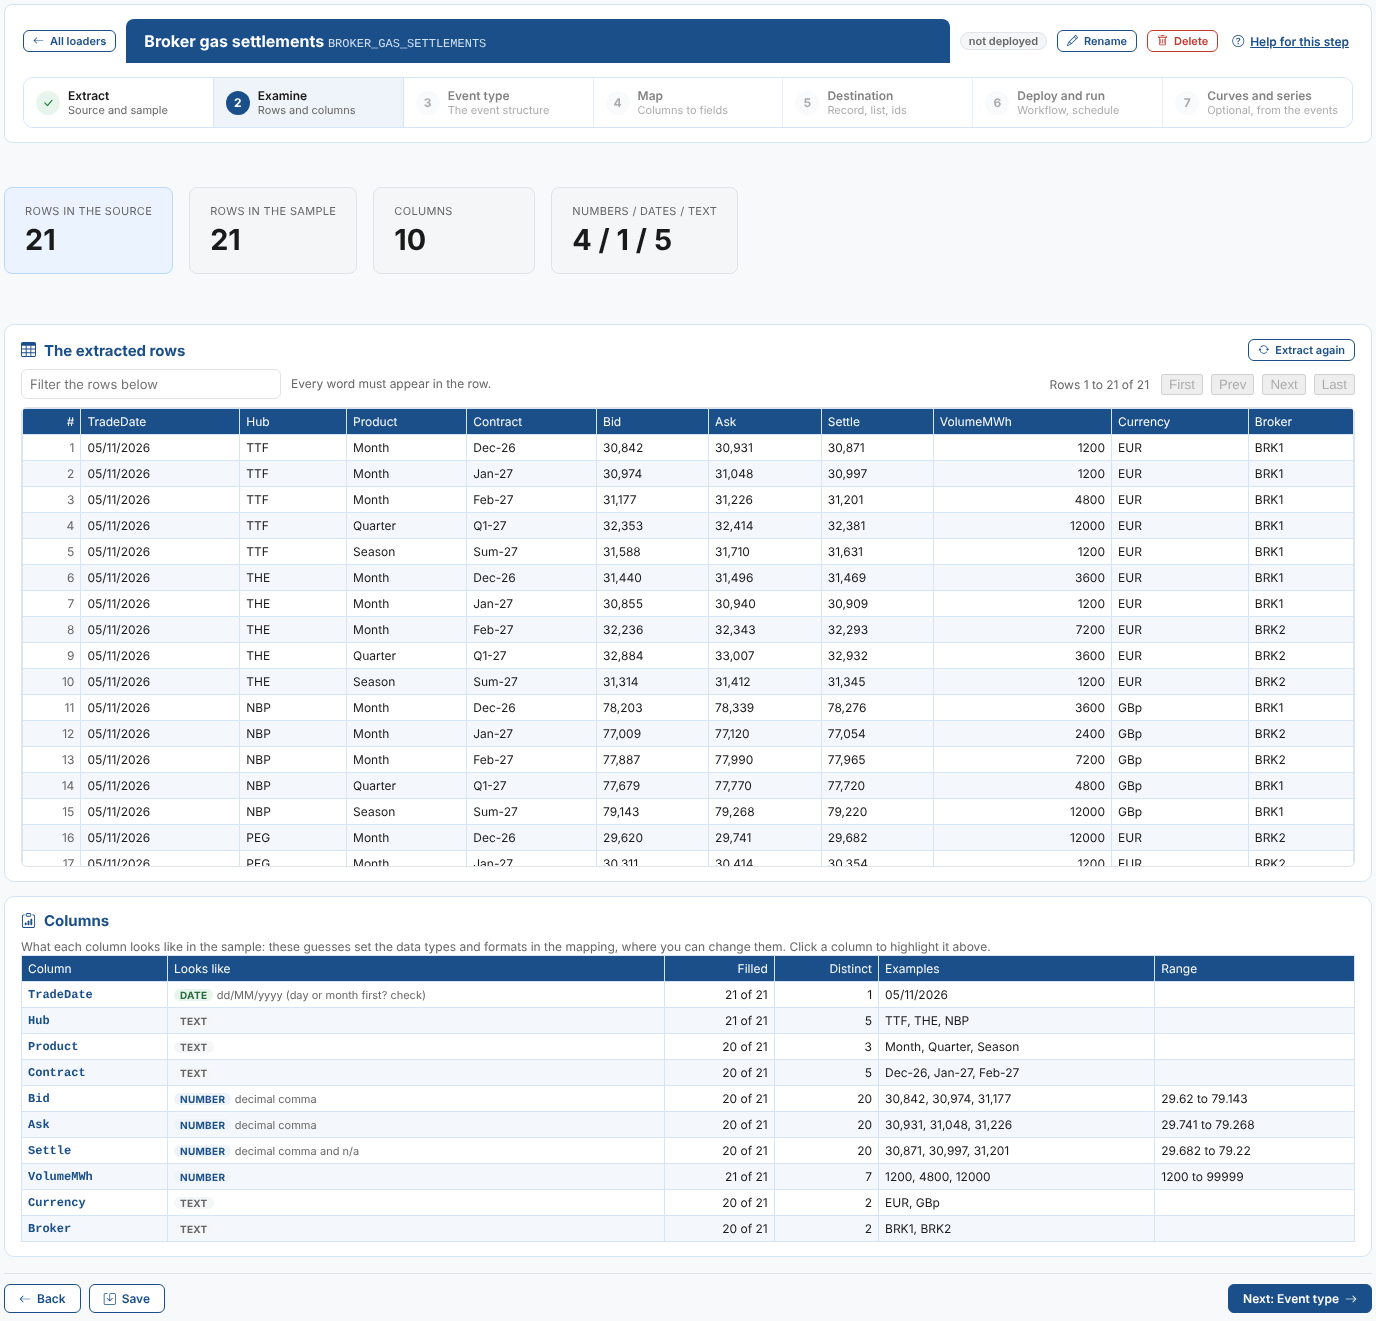
In our example, Northgate Energy's two gas brokers send a semicolon separated file every evening. The profile spots straight away that the trade date is day first, that the prices use a decimal comma and that Settle has an n/a in it. Nobody has to open the file to find out.
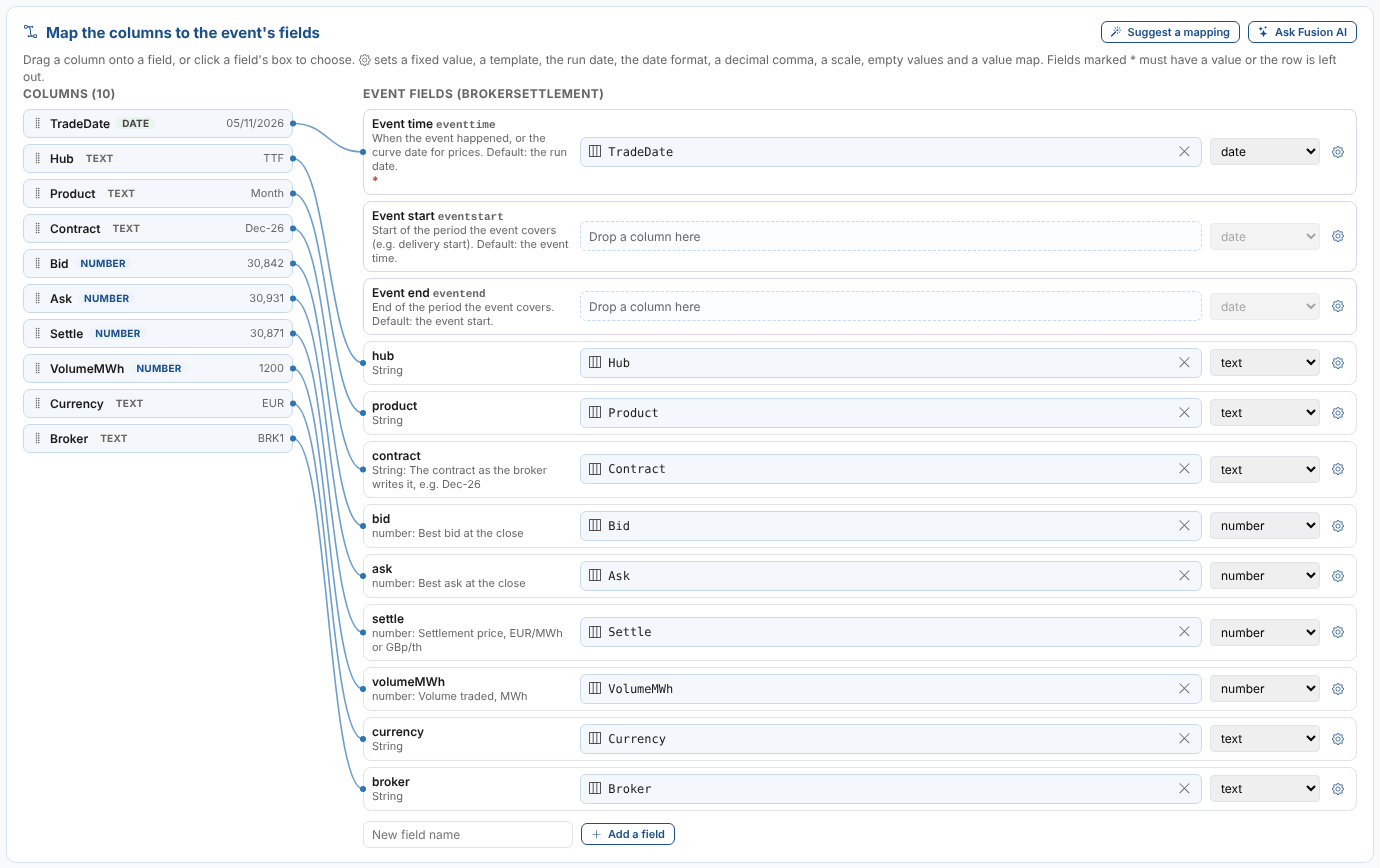
Map. Columns are on the left, the fields of an event type on the right. Drag a column onto a field and a line joins them. Each field has its own settings: the data type, the date format, a decimal comma, a scale, the values that mean empty, and a value map that turns the broker's Dec-26 into your 2026M12.
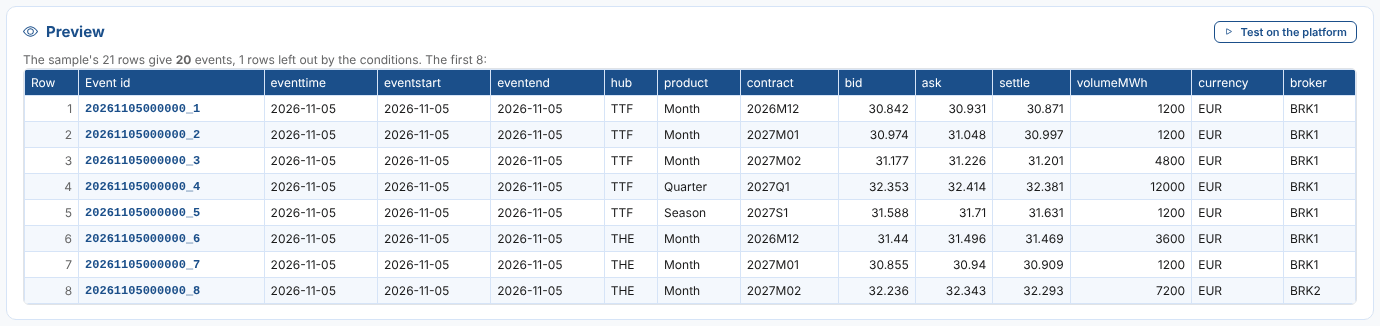
Then the preview shows the events the sample makes, before anything is saved: here, 20 events from 21 rows, with the broker's total line left out by a condition.
Fusion AI does the tedious part
Not sure how to map a file you have never seen? Ask Fusion AI. It reads the sample's columns and first rows and proposes the event type, every field's mapping, the rows to leave out and the event id. When there is a choice only you can make, it asks, with buttons.
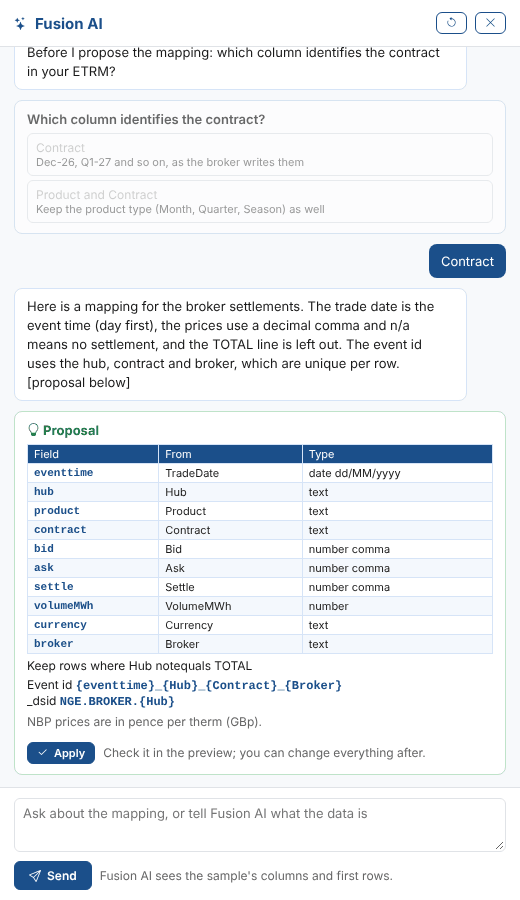
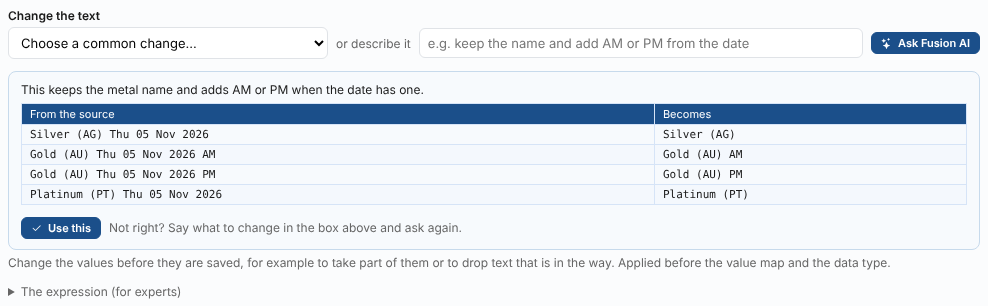
It also changes text for you. Describe what you want in your own words, such as "keep the name and add AM or PM from the date", or ask it to translate the Japanese product names into English, and it writes the change or a value map. You see what every value in the sample becomes before you use it.
Built for the messy sources
The sources that fall into the gap are rarely tidy, so Data Loaders handles the usual problems on screen rather than in a script.
One column per product. Government and agency spreadsheets often have the dates down one column and a product in each of the others, sometimes with a row of codes and a row of descriptions above them. Say that each column is a series, and the loader makes a master data record for every column, named from the descriptions.
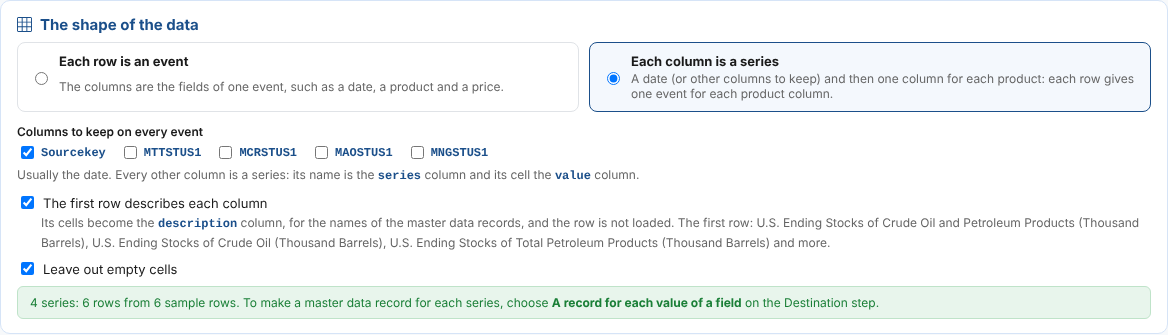
Only the columns you need. Leave out the monthly change, the notes and the columns nobody uses. Each column shows its spreadsheet letter, so you can see exactly which one is which.

The end of the data. Set the last row, or stop at the first empty row, so the totals added under a blank line at the bottom of a workbook are never loaded.
All the history, not just a sample. Some columns only start years after others. Extract all reads the whole source, so every column is seen before you define the type.
Japanese dates and text. Read Japanese era and calendar dates directly, and translate product names with a value map Fusion AI writes for you.
Working out new fields. Add a calculated field such as settle_gbp = settle * fx and every event gets it, worked out from the fields you mapped, with +, -, *, / and brackets.

No URL? Drop the workbook
Some data never comes from a URL. A client keeps it in a workbook and sends a new copy each month, or someone downloads a report by hand. A spreadsheet upload loader is made for these: describe the workbook once, and from then on anyone drops the latest copy on the page, checks what it makes, and loads it. Nothing is scheduled; the workbook drives everything.
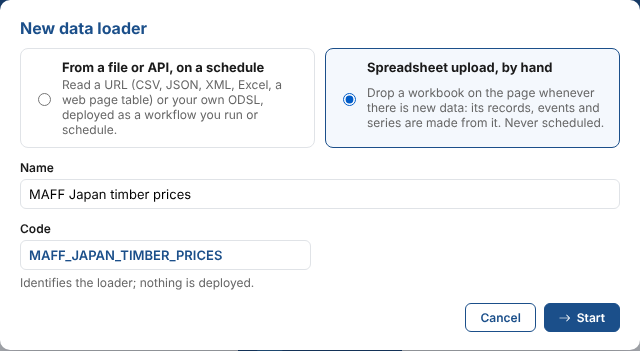
It reads two common layouts, and works out which one from the first workbook you drop:
- Three sheets: dataset information as name and value pairs, a row for each master data record with its properties, and the values with a column for each record and a row for each month. Japanese timber prices from MAFF come like this: nine products, 69 months, 621 events.
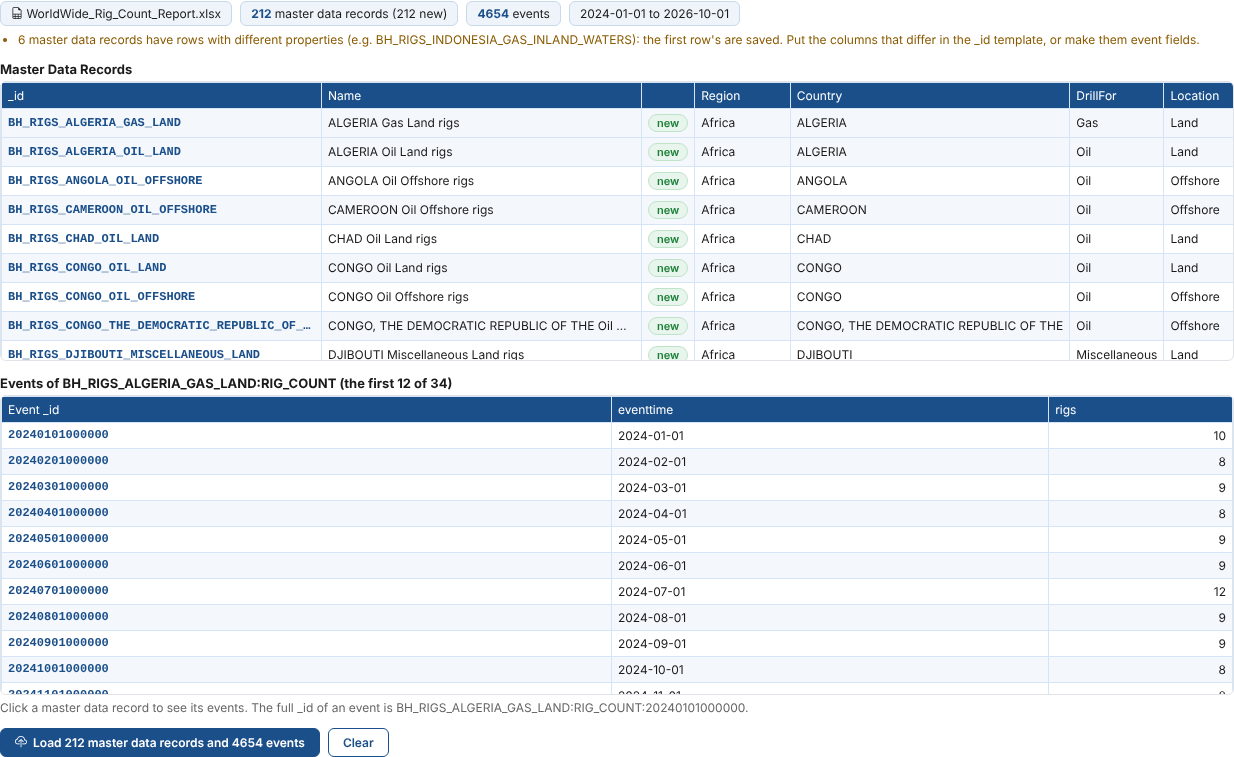
- One sheet, a row for each value: each row has the properties, the date and the value. Baker Hughes' worldwide rig count report is one: from its WW Monthly sheet, with the headings in row 12, a record for each country, fuel and location, and an event for each month.
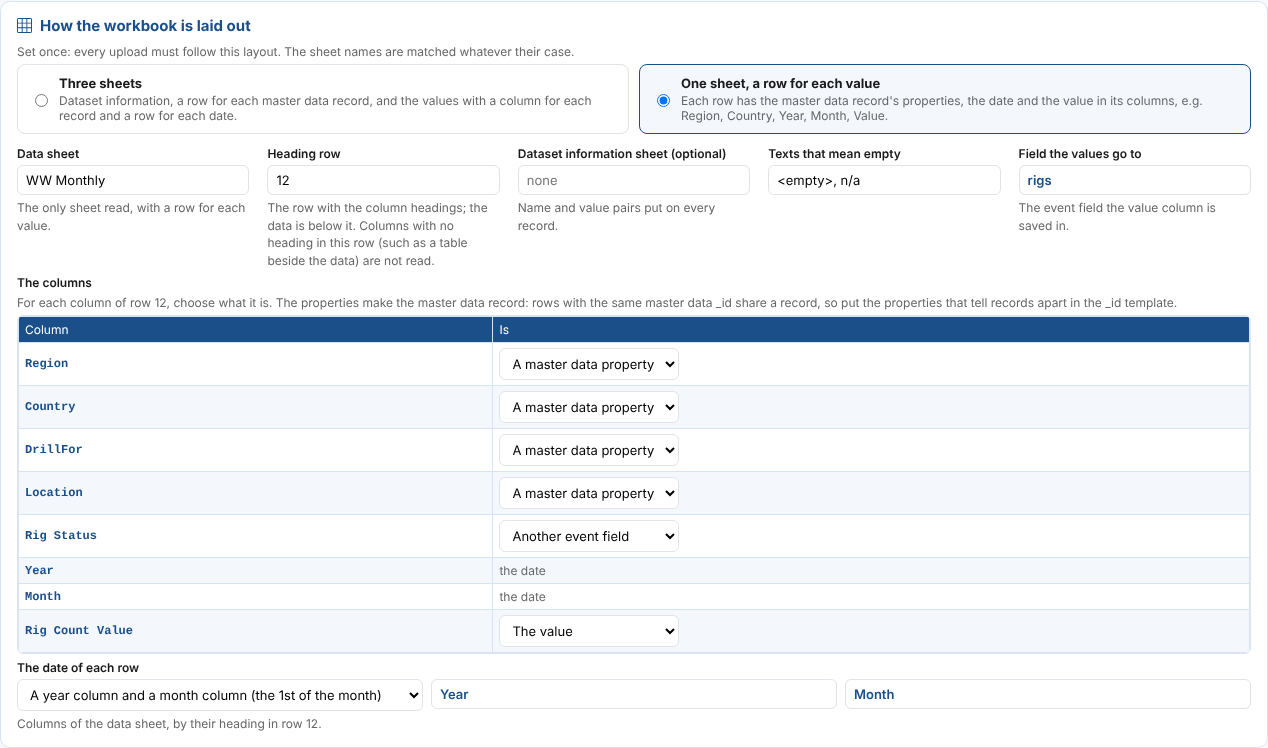
You choose the master data type, the event type and the set of series each upload makes, and build the master data and event _id from templates such as BH_RIGS_{Country}_{DrillFor}_{Location} and ID_{eventtime}. Add more properties to every record, from the type or your own, and calculated fields that use them, such as real_price = input_price * ConvertedFactor.
Before anything is saved, the preview shows every master data record, new or already there, with its properties, and the events each one gets.
Web pages, API keys and many calls
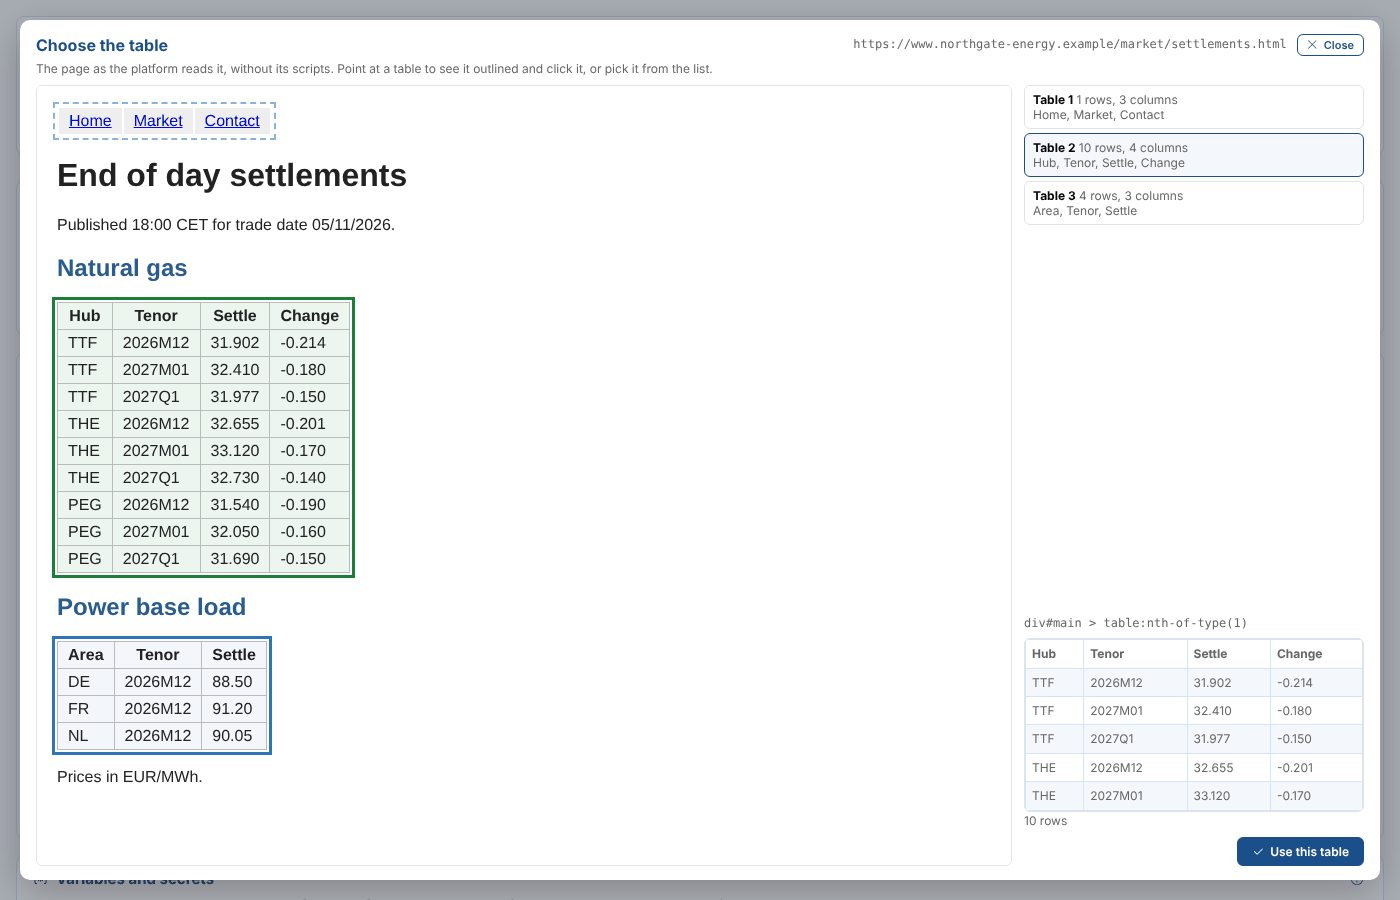
Tables on web pages. Show the page, point at a table and click it. The platform remembers which table it was and reads it the same way every run.
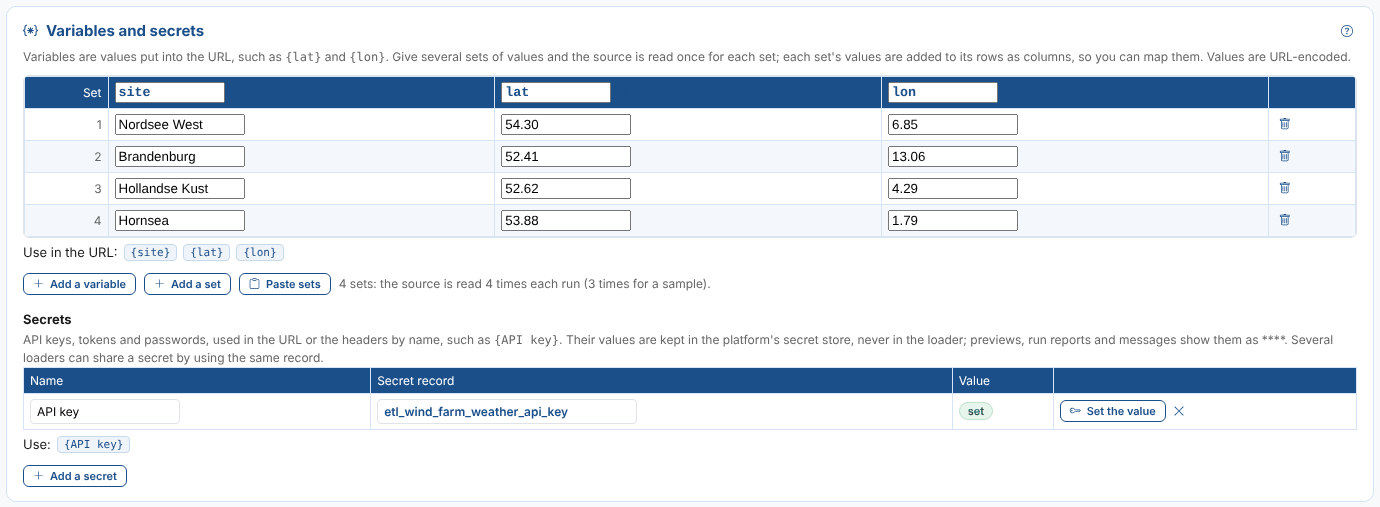
Secrets and variables. An API key goes in the platform's secret store, never in the loader, and is masked in every preview and run report. Variables call the same API once for each wind farm or product code, and every row says which call it came from.
Scheduled from day one
A tactical loader is still a proper one. Choose the master data record, the event list and the event id. The id is built from the event time and the columns that make a row unique, so loading a file again replaces its events instead of adding copies.
When every check passes, one click deploys a workflow of the standard extract, transform, load and report actions, and a process that runs it. Choose weekdays at 18:30 UK time, every hour, monthly, or any schedule you like, with a holiday calendar.

Run it now for today, or for any earlier date. For a source with years of history, tick Load as history and the first run loads it all in one go, without running the automations for every date.
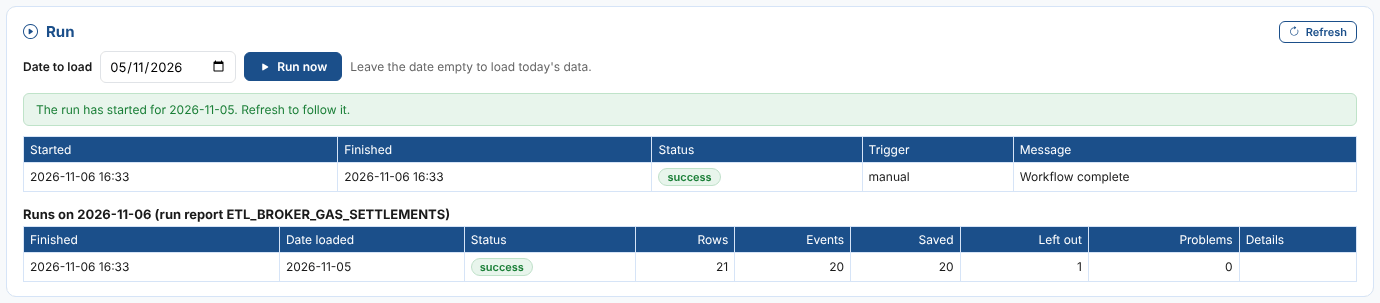
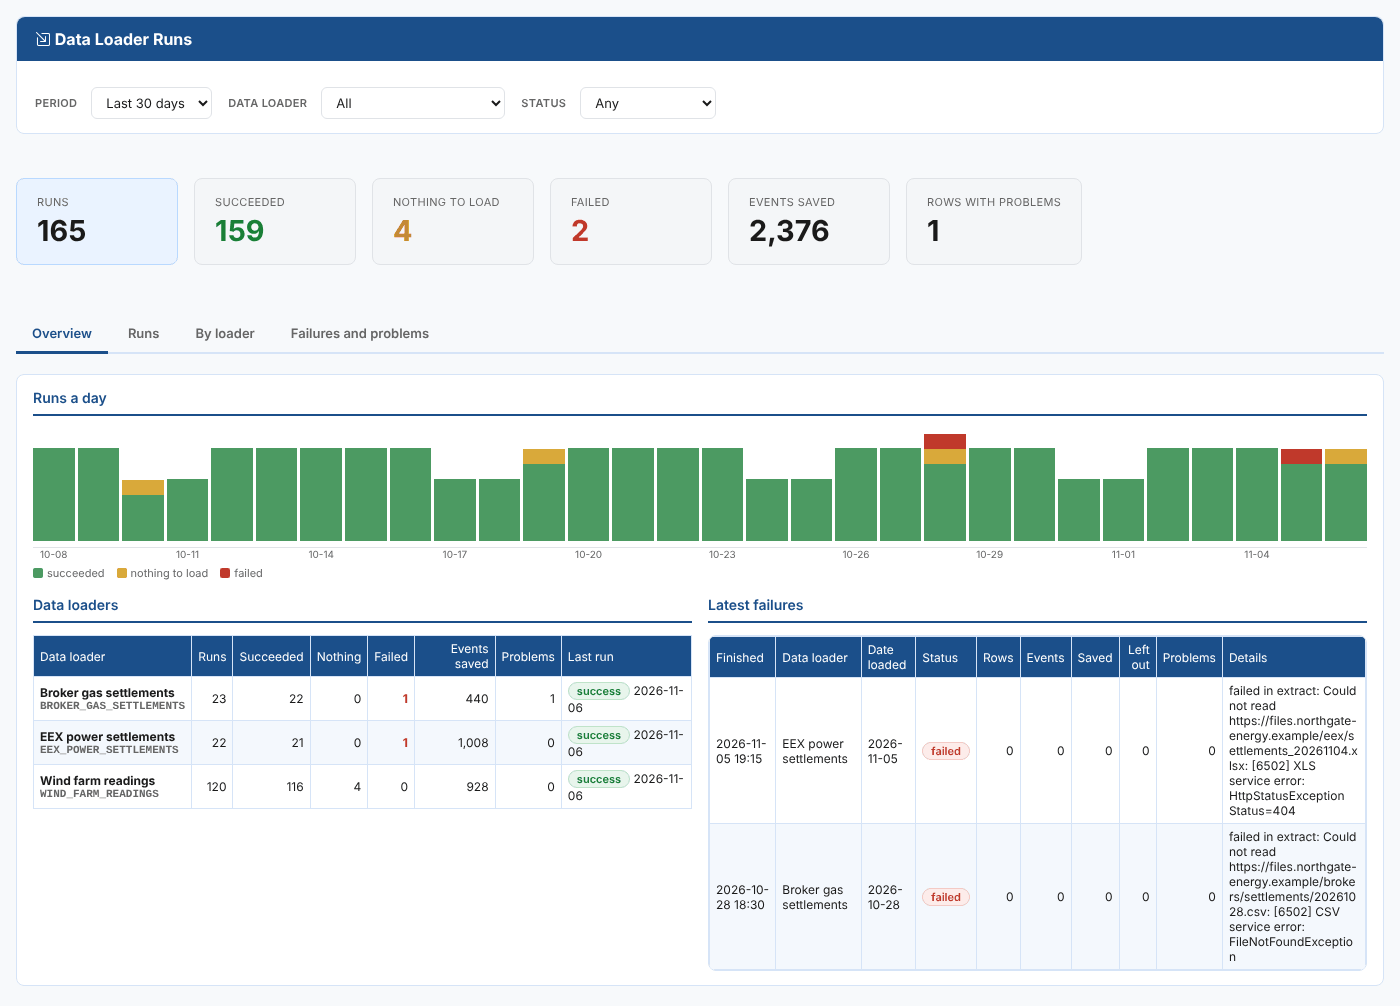
A run that cannot read its source or save its events raises an alert, so the team hears about a missing file before the traders do. The Data Loader Runs insight shows every loader's runs, failures and problem rows in one place.
Series on every record, the same way every time
Loaded events are useful on their own, but most of the time you want a series or a curve. The last step makes event timeseries, forward curves and option chains from the events, on every master data record the loader fills, with the calendar you choose.
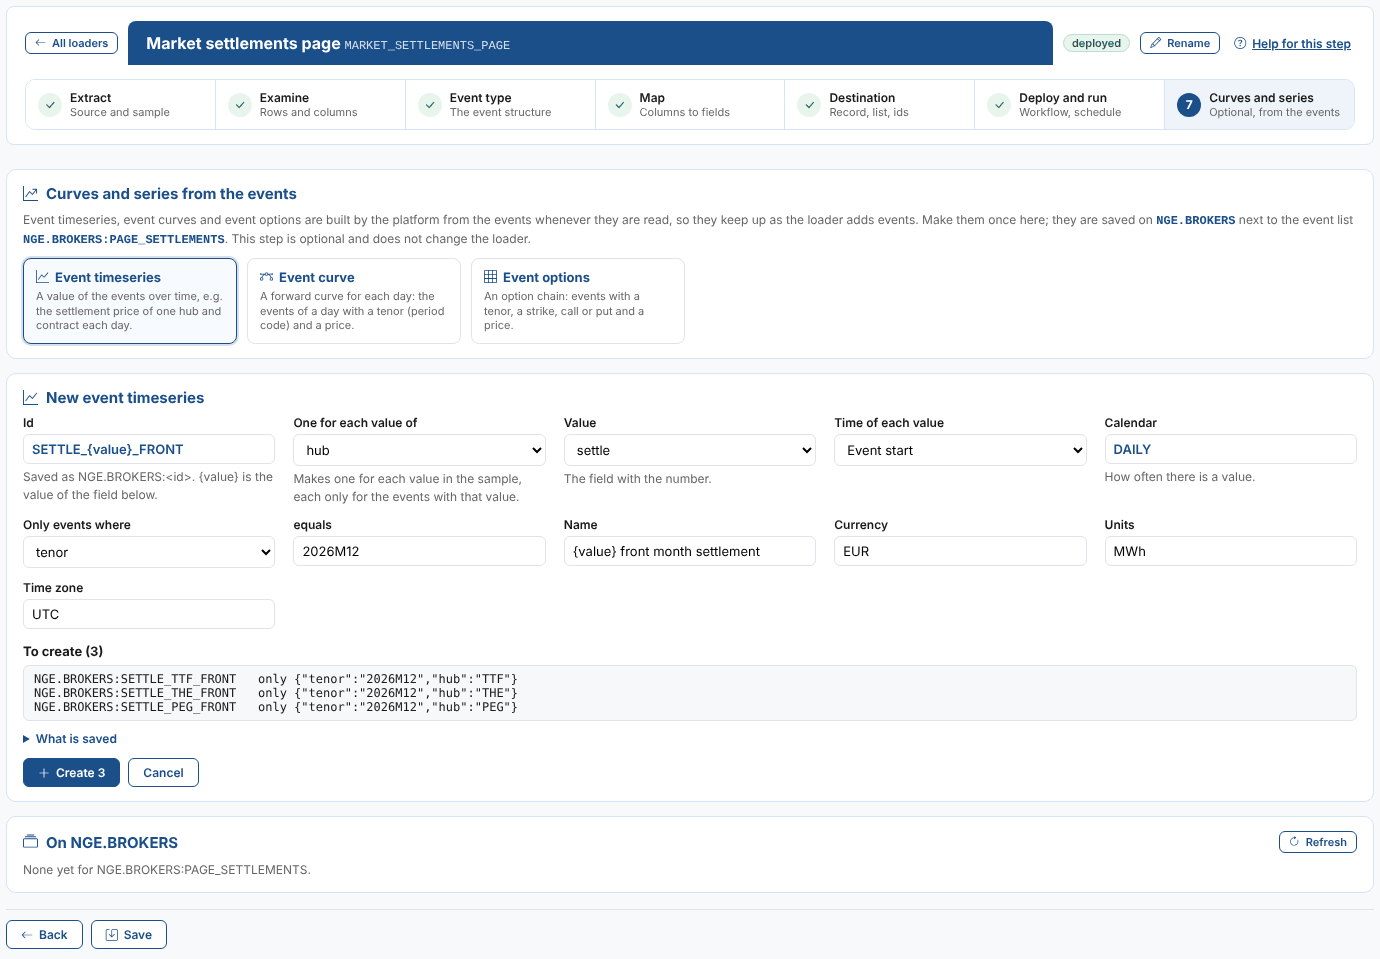
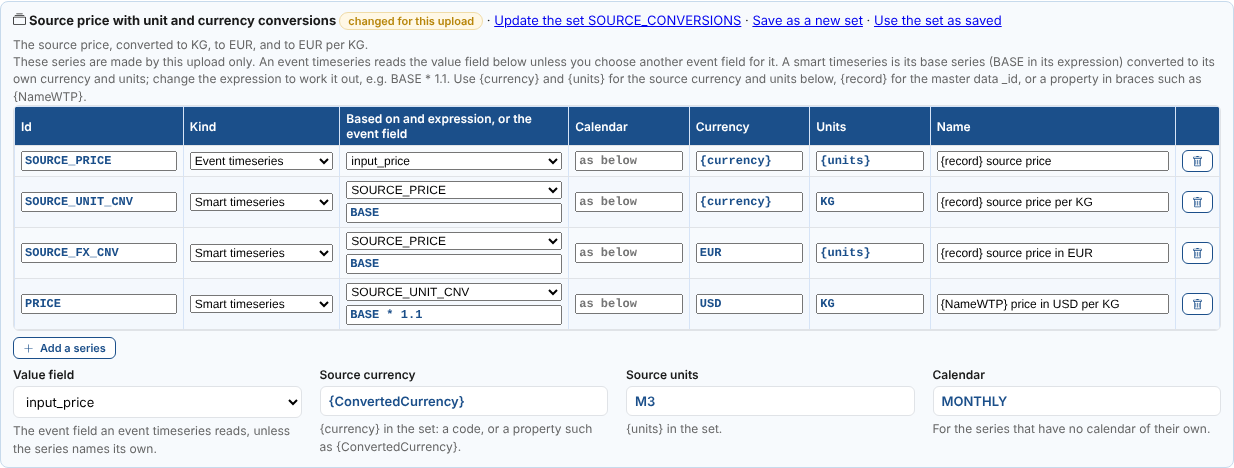
If your team always makes the same series, save them as a set. A set of SOURCE_PRICE, SOURCE_UNIT_CNV, SOURCE_FX_CNV and PRICE only needs the source currency and units: the unit conversions and the euro series are made from them, on every record, in one go.
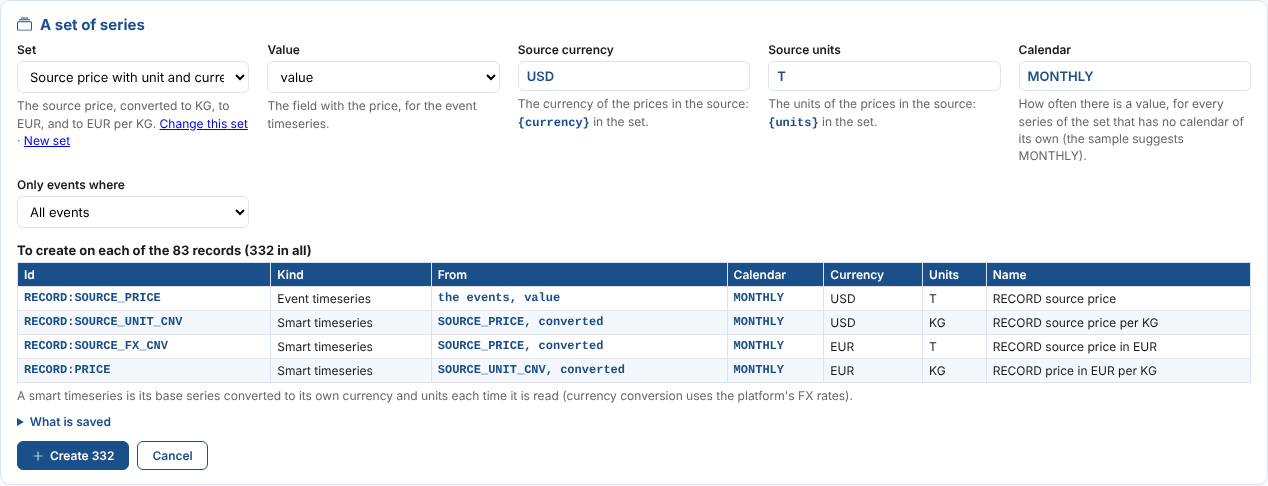
Each event timeseries can read its own field, and each smart timeseries can have its own expression, such as BASE * 1.1. A spreadsheet upload can change a set's series for itself only, then update the set for everyone or save it as a new set.
From sandbox to production, and beyond
Give each loader a stage, from sandbox through development and testing to production, and filter the list by it, so everyone can see which loaders the business already relies on.

And if a source grows into something the business depends on every day, the loader has already done the hard part: the mapping, the event type and the series are on the platform, ready for a managed feed to take over.
Getting started
Data Loaders is available now as an extension for OpenDataDSL customers. Open Operations > Data Loaders, select New data loader, and point it at the source you need today.
The documentation covers everything in detail:
- What are Data Loaders?
- How data loaders work
- Building a data loader
- Mapping columns to fields
- Sources
- Deploying, running and scheduling
- Curves and series
- Spreadsheet uploads
- Fusion AI
- The Data Loader Runs insight
Get any source into the platform today, and on a schedule.
OpenDataDSL - Go Beyond the Basics.
Next steps
Is there a source you need on the platform this week?
Send us an example, and we will build the loader with you and show you its first scheduled run.
- Contact us at info@opendatadsl.com
- Sign Up today and become part of the OpenDataDSL community!
- Fill out the form below, we will contact you to arrange a personally tailored demo.

How about a demo?
Our team is here to find the right solution for you, contact us to see this in action.
Fill out your details below and somebody will be in contact with you very shortly.